Yesterday we deployed a feature that allows the users of Pitch Like This to analyse the performance of the campaigns they create and share. This was important, because now the campaign creation feature looks complete - it was absolutely incomplete without a feedback mechanism.
This is how the feature looks: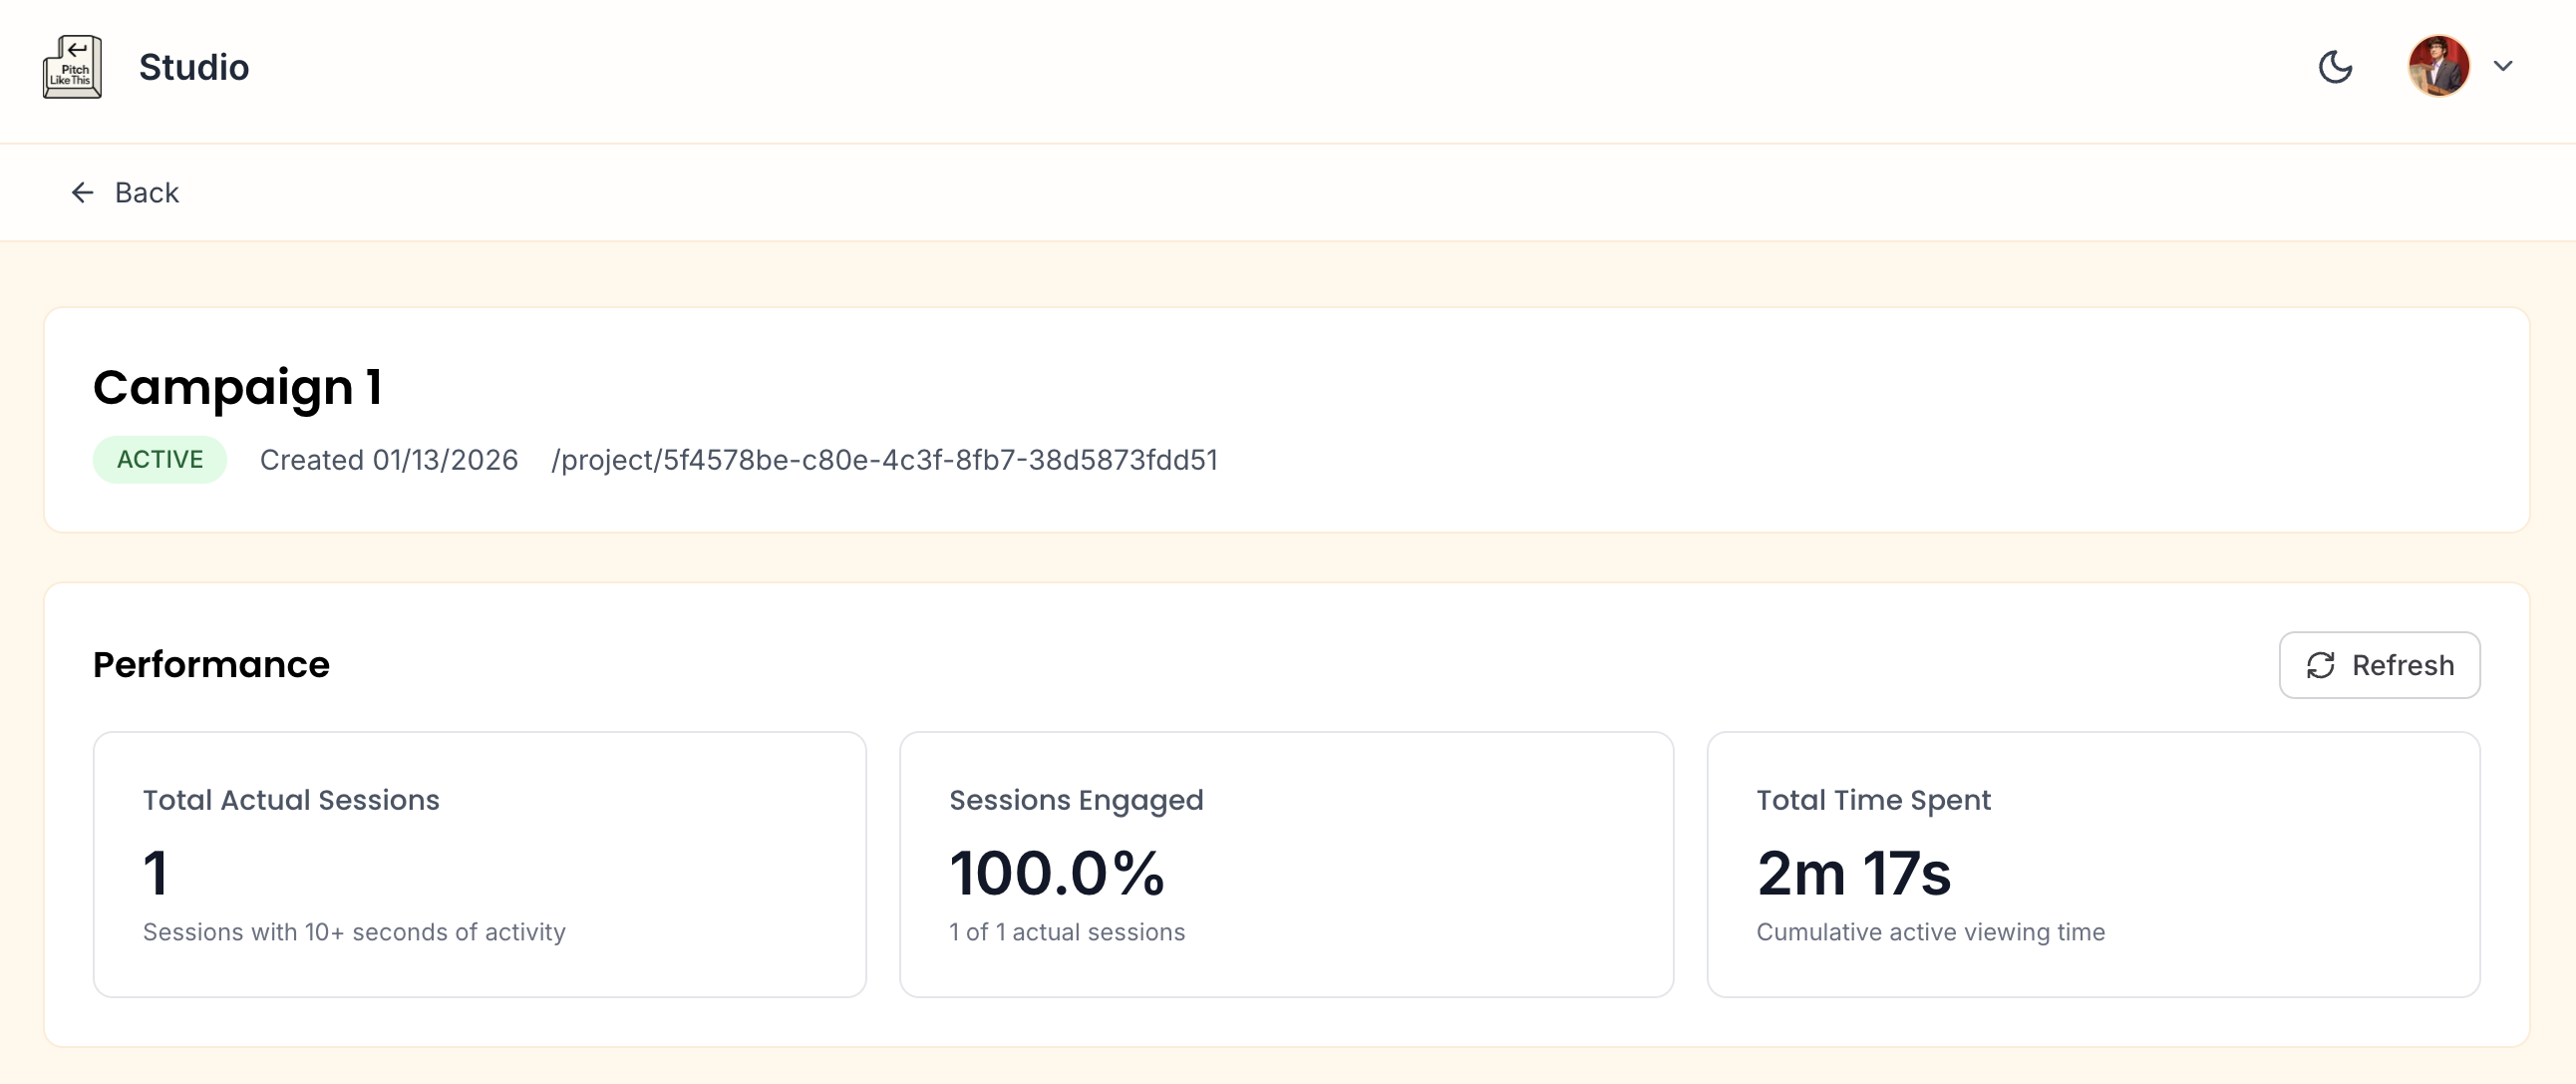
Post the user creates a campaign and shares the link - we record the interactions on these links. And those interactions are displayed in the performance section.
The section displays: Total Actual Sessions, Engagement Rate, and Total Time Spent for every campaign.
Let’s understand what those metrics mean.
Sessions
In most analytics tools like Google Analytics, Heap, Mixpanel and others - a session is continuous stream of events until the user goes idle or inactive for 30 minutes. So session is a dynamic sliding window trigger for inactivity.
My intention was to design sessions in the same way - but we ended up with a static 30 min static window counter. So Pitch Like This analytics session is a static 30 minute time period since the initial load of any campaign pages.
While I am thinking if I should move it from static window to sliding window. The static window might not be as bad for our use case atleast for now. Meaning,
- I am not expecting a single user to spend more than 30 minutes of active time reading the campaign pages. Campaigns are just 3 pages - Summary of Applicant, Their Case Studies, and a Call To Action.
- The main benefit of sliding window is to containerise activity better where active time spent of the tools is huge - like making presentations, designing in figma, etc. So given that most of our sessions ends before 30 mins - there won’t be an inflated number of sessions to actual users.
So even with this fixed window, I am expecting a single session per visit.
Moving to sliding window will also add more complexity of measuring idle time across different devices, mobile and desktop. Possibly looking out for mouse moments, phone interactions and so on. In hindsight it might just be good engineering to not complicate - instead focusing on accuracy of measurements would give us much better impact.
Actual Sessions
Any sessions where the user loads the page and exits before 10 seconds - I am considering these as simply ‘New Sessions’.
A session is flagged “Actual” only when a user spends more than 10 seconds on the page post load.
Bot Sessions would generally be in the category of page loads with 0 to 2 seconds. Mistake clicks or not interested humans would ideally close the tab within 10 seconds.
There can be bots or humans that would load a page an click within these 10 second window - even those will not be considered as actual sessions. The first page that loads is a Summary of an Applicant who is pitching, so I am expecting a hiring manager to invest time reading.
Engaged Sessions
Engaged Sessions are Actual Sessions with more than one events. An event can be any CTA Click that include Forward Navigation, External Links to Case Studies or Form/Lead Submission.
A Link Open is an event that automatically fires once per session when the page loads. So any event post this is an actual human engagement.
Given the 10 second and 2 events firewall - I am pretty confident that an engaged session can be considered one of the campaign success metrics by campaign creators.
On studio we display engaged sessions as a percentage of actual sessions giving us an engagement rate.
Time Spent on Campaign Pages
To measure time spent, we send an Heartbeat event every 30 seconds that the user is active on any of the campaign pages. If the user is on desktop and switches to another window, we track siteVisibility as hidden or if tab are switched we track for blur and focus within desktop. For mobile devices, we replace blur and focus with page hide and page show.
The heartbeat flushes the accumulated time whenever the pages go hidden and then start a new heartbeat when the user is back.
What we will see in the Studio Performance panel is the sum of all the heartbeats for that campaign across all sessions (or users).
I believe this could prove as another success metric for campaign creators who are looking for feedback to help optimise their campaigns so that they convert better.
Now coming to the Engineering. I want to explore roughly the architecture and the problems I encountered.
Architecture to record Analytics Events
Following is a Sequence Diagram explaining the systems and the communications involved in this analytics flow.
The ‘Applicant’ who might be applying for a job or looking for freelance opportunities creates a Pitch (Pitch Link) and shares it. The ‘Employer’ who is a potential client or someone who is going to hire the applicant refers to the pitch to make a decision about hiring the ‘Applicant’.
![]()
Generating Session ID and Database Configuration
Philosophy: Analytics should never restrict the utility of the application for the user. Hence analytics is a lower priority compared to the usability of the application - we prioritise for speed and delivery of the utility and ready to drop the analytics data when it might create restrictions.
- Sessions and Events have a UUIDv7 as their Primary Keys. UUIDv7 are time sortable keys as they are appended with timestamps.
- Analytics Session ID is generated on the server side. Hence it requires an API call.
- Session ID is only generated post the Content within the page loads - this is to optimise the page loading metrics. However the impact on these metrics is a resultant of lot of optimisations.
- The Analytics Session ID is shared back to the client to be stored as a cookie for repeat use for tagging the events.
- The Session ID is stored as a httpOnly = false, secure = true, and sameSite = lax. httpOnly false makes to cookie accessible via JS - however it cannot be used to access sensitive data - hence security is ensured.
- Session Cookie expires 30 minutes post creation, server creates a new cookie and sends to client post every expiry.
- Database is the source of truth for the session ID - it records the Project ID, Campaign ID, and User ID against every session created. All these identifiers are fetched when creating an analytics session.
- The session ID is mapped with Events in a separate table
- In future we can provide a more detailed analytics:
- Currently active users and the events they are triggering
- The sequence to events that a user triggers in a continuous flow
- Identify which exact buttons were clicked by capturing the text on the button
- Other additional items that we record against a session are:
- We store User Agent against a Session but do not use it - in future we can either use it to remove duplicates (we currently dedupe by session ID OR we can parse the user agent to track Device and Browser details). User Agent is SHA256 hashed.
- Session Start and End Timestamp: Records the date time of session start and end.
- Session Flag: Records if the session is a New Session, Actual Session or Engaged Session
- Cumulative Time Spent engaging with the session. This is used to further aggregate the Total Time Spent on a campaign.
- The Session API is rate limited to avoid abuse
Scope for better engineering
- Generating Session IDs on the server side creates a bottleneck. First we are required to make an API call at the same time the browser is loading the page. Second, if the API fails, no events can be collected without a session ID. Any retries risk creation of duplicate session IDs on the server side. → Standard practice is to generate all analytics related identifiers on the Client Side
- As discussed earlier, a sessions should be defined as “30 minutes of inactivity” - this is a more robust definition suitable for tracking all types of applications.
Batching the Events
- A link_open event is triggered once every time a new session is successfully created in the server and shared to the client
- Events are batched in the client. A call is triggered to the server either post 10 events or 30 seconds. The call sends the batch of events to the server so we can process it further.
- Events are flushed if the website goes hidden or blurred or if it is closed. Flushing allows us to collect the final events before the user abandons the website.
- The events API is rate limited to avoid abuse
Scope for better engineering
- link_open event is not adding any direct value. Any first event can be considered as the user opened the link or the session creation itself can imply that a link was opened.
Measuring Time Spent
- Heartbeats are sent every 30 seconds while the user is active on the pages we are tracking.
- If the user switches to any other tabs, or closes the window. This behaviour is detected and the elapsed time is flushed. The heartbeats are not sent when pages are active.
- The sum of time increment in all these heartbeats gives us the total time the user actively spent on the pages. We record this time against sessions in our database.
- Database does not record each individual heartbeats like we do with event clicks. The heartbeats are sent to the queue - a worker collects and processes the final data into the database.
Using Redis Stream as an Event Queue
- While there are more specific solutions for an event queue - like AWS SQS and Pub/Sub by Google. Upstash allows a free tier without and credit cards - hence that was the fastest way for me to implement.
- Also with the same Redis Client I would be able to implement the Rate Limiting which is necessary for analytics related APIs.
- 500k commands are free every month with Upstash. The server routes all heartbeats and events to the Redis Stream under consumer groups.
- When processing these queues, we XTRIM the consumer groups if they reach more than 10000 keys. The Redis at its end manages the queue ensuring the processed and pending keys.
Supabase Edge Function as a Worker
- Supabase allows over 500k invocations per month. I am invoking the worker every minute with a pg_cron. So we are well under the invocation limits.
- For testing the edge function in local via Supabase CLI - I had to use Deno to process the runtime. In local we need a Supabase Service Role Key to trigger the edge function.
- On contrary we can trigger the Edge Function with an Anon Key in the production.
- I had the keep the JWT Verify as False in local and kept the same in prod. When JWT Verify was true the worker would fail to verify JWT - likely because of some symmetric vs asymmetric token mismatch.
- We created a separate database function to invoke the worker. In local, if using Docker, we need to trigger the worker with base url of docker
host.docker.internalor172.17.0.1. However Postman based trigger would work with a regular localhost url. - If a Database Function is used for Edge Function Invocation - we need to provide the Authorization Key and URL to this function. An Edge Function automatically fetches ENV variables from system without us requiring a declaration. However the database function has to be passed with env variables - on production I had to add the URL and ANON KEY within the Vault and then retrieve these keys from the vault and use them to invoke the API. All this was done within the database function. On Local however we do not need to use a Vault and can set system variables directly - however its better to have the same implementation in both environments.
Troubleshooting
I spent a lot of time debugging why my database function would not invoke the supabase worker. The Docker url was the reason. I also spent some time trying to create the edge function in production via Supabase Browser - however the best way to deploy is to run supabse functions deploy. I did not get any external import related error with CLI deployment.
I had a separate /supabase/functions folder committed to Git for the Edge Functions. I had to add a .vercelignore to exclude this folder so that the deployments to Vercel do not fail.
Likely reasons for the invoker failing:
- The invoker if a database function, may not have the environment variables
- The Invoker uses
pg_netto make a POST request - it first generates a request_id and then uses that request_id to run a POST request. First check if the request_id is being created and then use it to run the API.
Next time when dealing with Edge Functions,
- I would use CLI for function deployment
- Use Vault for all db environment variables
PG Cron via Supabase
- I deployed the Cron using migrations, however I had to debug it as it was failing due the Invoker function failing.
- Post the invoker was alright the Cron would still not trigger - I did not end up finding the root cause, but deleting and creating a Cron manually on Supabase Dashboard and setting it to a minute frequency solved the issue. Initially I had the Cron set at 30 seconds interval - but that would fail in my case.
Troubleshooting Cron
- Fix the Invoker that the Cron triggers. If Invoker is failing, ultimately Cron shows no effect and the system likely pauses it.
- Reschedule the Cron if its failing even after Invoker is Fixed.
- If still not working, delete and recreate it from Supabase Studio. Consider setting a frequency of one minute or more.
General Security Aspects
- I had to make sure all Database Functions that are being used by the Worker and are Security Definers are Revoked Execute Access from public, anon and authenticated. Only postgres and service_role need to have access to these functions.
- I redefined some Database Functions from Security Definer to Security Invoker while make sure the RLS policies are defined. Hence any open functions that do not require Auth are still restricted from unwanted access. Security Invokers unlike Definers follow the RLS policies.
- I created the analytics related tables in an internal unexposed schema - meaning the POSTgres is not activated on this database are there are no open APIs. Much more safe for sensitive data like analytics.
- I created a VIEW in the public schema to only collect and make available analytics data that is to be shared with client. This View has a revoked access to public and anon with a ownership clause ensuring only owners of a campaign can view the analytics.