This has unintentionally become a third part of the RLS series.
Part 1: Setting Up Row Level Security Policies - I try to frame a stepwise approach on how to setup the first iteration of RLS policies
Part 2: Debugging RLS Policy Issue with Supabase - I debug an Insertion operation related issue that returns RLS violation, while we do not end up identifying the root cause of why RLS fails here - we bypass it by recording a JWT fingerprint for all guest users.
Part 3: Which brings us to this part. My product is live as a BETA.
- I had an instance where a tester reported not being able to create a Project because of RLS restriction - this was an error specific to a user, and not global.
- Second, the production APIs for database operations are really slow - I am going to have a huge churn if I do not fix them.
Identifying the root cause of the problem
Earlier I had a single database for both prod and dev - but now I have diverged into independent services, so hopefully I am not gonna break prod.
Supabase CLI for Dev Database
I used Supabase CLI to create a copy of production database for my development server. So the RLS, functions, and schema are exact replica of production versions. I even have the Supabase Dashboard helping me manage my dev database.
Let’s review CPU and Memory stats in both the databases,
API Gateway
The following stat says average API response time is 769 milliseconds in PROD, we have to reduce it below 300 milliseconds.
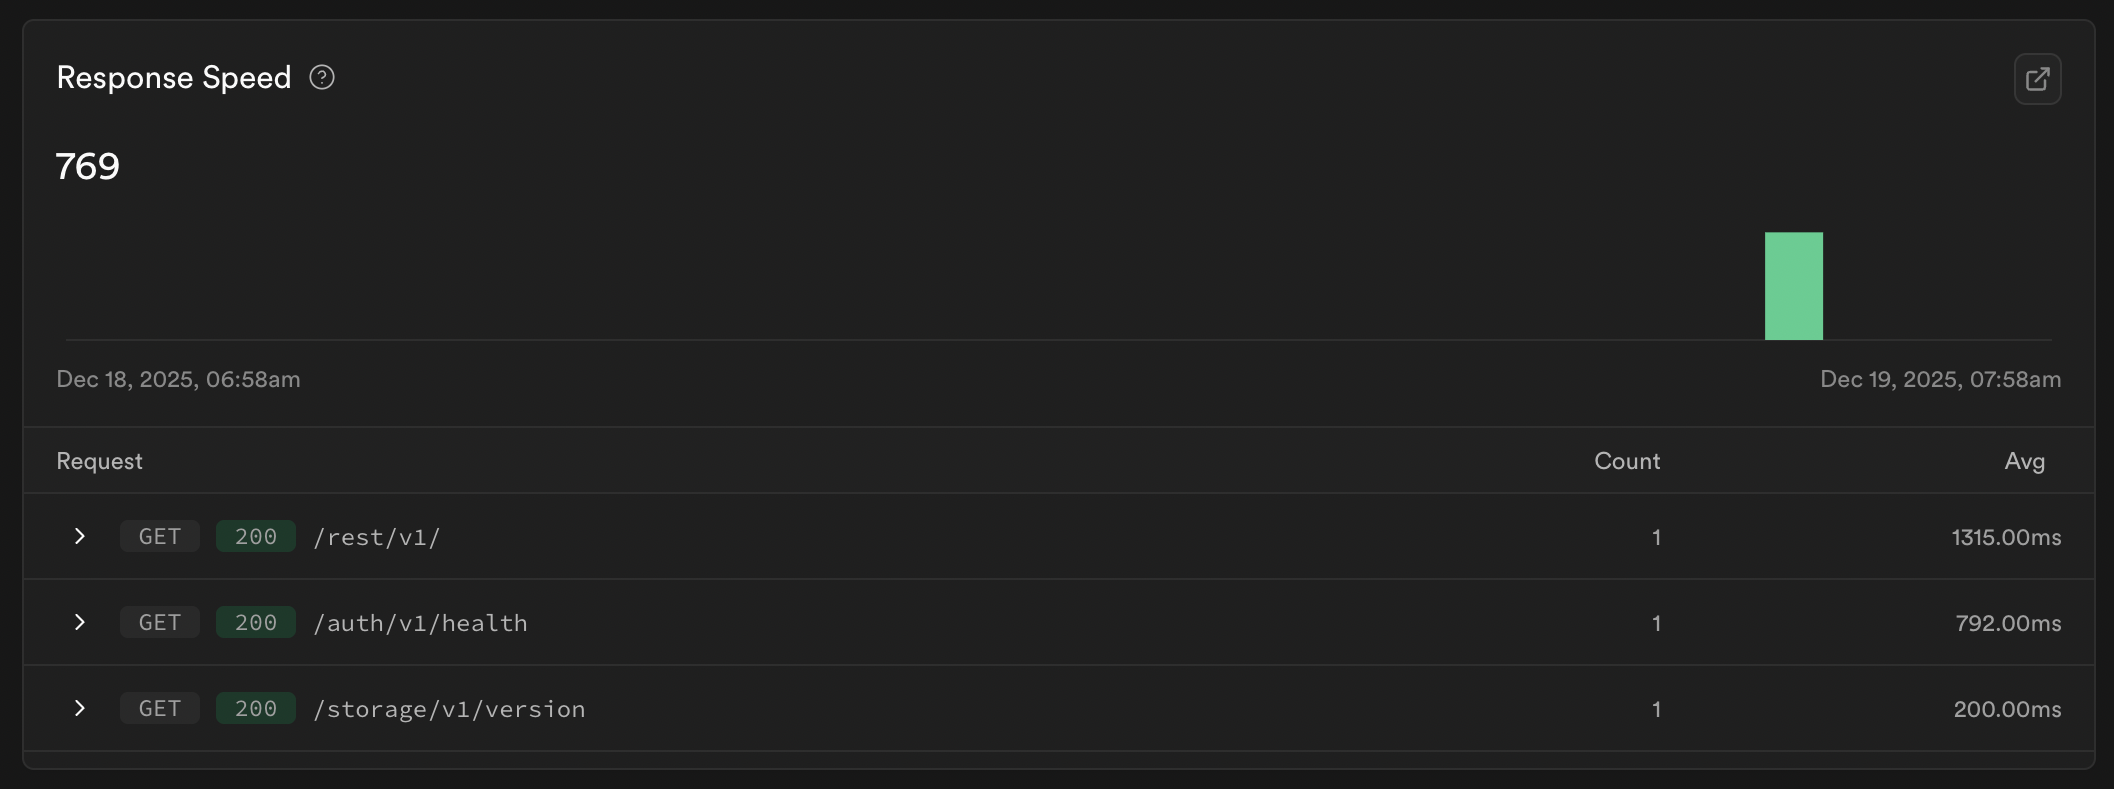
I don’t have to same report for dev likely because the volume is less - however from manual testing APIs are executing easily below 300 ms.
Query Performance
Dev says:

Prod says:

Good News: There are no queries specifically related to our tables that are flagged as slow - the queries flagged are postgres queries that run for internal dashboard updates or to assist our tables.
Like for instance pg_timezone_names is listed as the slowest - I am gonna ignore these for now because as per google these are to be expected and I cannot do much about them other than indexing. And I don’t indexing is gonna solve this either, the timezone table has just 100 rows - I am not sure what’s making it slow or why it is being flagged so.
Cache Hit Rate
Number of cache hits by total requests. Cache hits are better because the server can then skip querying the database.
The database is too small (30MB) to have this metric tell us much. The disk space available is 7.7 GB for a free Supabase project - so our database fits entirely into the memory.
Its good to keep an eye on this as we scale - for Postgres CHR should be above 95%.
Average Rows per Call
I misunderstood this metric, yeah fell in the pit of thinking it should be low. To explain this metric in simple terms,
Its better to request your wife or order your husband a list for the groceries to purchase over the weekend rather than them telling you items one by one as they remember
In the above example your wife will start a batching operation if you ask for a list, she will collect all requirements until the batch fills up - this saves us loads of processing time in terms of request → processing → response.
For web simple applications, average rows per call should be between 10 to 100. However that can be taken to 100 to 500 if the application if there’s logic based UI operations. I think my app falls in this category.
Currently the metric is not much relevant because the volumes are less - however when we get more traffic, we got to run more optimisations and take this above 100.
When there’s less number of rows per call - there’s a high probability of network chatter which is not energy efficient. Lots of energy spent in security handshakes, encryption-decryption, metadata, and storage.
Counter to this an extreme amount of data shared with client can as well affect the client side performance or lead to leaks/mismanagement. So this is a metric which requires balance.
I am going to try running some EXPLAIN ANALYSE queries in production to identify how our queries are performing.
Does number of concurrent requests affect rows per call?
Even if there is a single beta tester on the app - the rows will be returned as per database driver configuration. Concurrent users fight for CPU - hence the metric in this case will be Requests per Second vs CPU Usage.
If an application is slow while having minimal requests per second, the likely causes are,
- The queries are heavy and require indexing (generally will not be a major cause of issues if tables have less than 100 rows)
- The fetch size is low leading to a lot of round trips in fetching data.
Supabase has max 1000 rows per requests as a default setting. So we can eliminate both these issues as being the root cause.
So Bad News: We don’t have a root cause yet. Let’s keep digging!
Infrastructure
CPU Usage
Defines the processing power that we have available. Supabase gives us a free Nano server which is a shared CPU, I am not sure of the cores.
Regardless we do not need to upgrade anything here for a while, CPU Usage is just at 2.5%. Ideally should be in range of 40% to 70%. And in case there are bursts leading to 80% or above we should consider scaling - at 95% server will start freezing.
Factors involved:
- Missing indexes
- High concurrency
- Complex SQL queries with JOINs
Memory Usage
Supabase free version provides us with 0.5GB. Our current usage is at 40% daily average. Ideally should be 70% to 85%. Needs upgrade before it starts average more than 90%.
Memory Usage is relevant in context of Working Set - meaning amount of memory usage per user is our metric here over total database size. Database size will matter when we are running out of Disk Space, which Supabase provides 7.8 GB available for use.
Factors involved:
- Working Set size
- Memory Usage per User (Projection)
Disk IOPS
Refers to input output operations per second. This is directly in relation to cache hit rate and max rows limit that we have set. If Max rows is extremely low and data is not available as cached - there will be a lot of I/O traffic for disk to handle.
We are safe here as well as it is just 1% of total bandwidth (Supabase allows 43Mbps in bandwidth for free and burst limits are 2085 Mbps). Ideally should keep this below 80% capacity.
Supabase uses SSDs so the latency must be around 3 milliseconds.
Factors involved:
- Very less rows per call
- Heavy operations like logging or backups
For Scaling Infrastructure
If in case I have enough usage to scale up,
- Vertical Scaling: all I need to do is move from Nano to Micro or Small compute size - it will increase all the three categories above.
- Optimisations for scaling should include: A separate replica db for SELECT operations, using Redis for additional caching mechanisms.
- Horizontal Scaling: As a final step have multiple servers, when a single server starts reaching its limit
Security and Performance Warnings
Now coming to the part where I think we will find our root causes. There are 40 Warnings in the performance advisor, at first glance it looks like we can optimise our existing SQL queries.
For each warnings I’ll attempt running EXPLAIN ANALYZE before and after to see where we went wrong, on how big the problem was.
EXPLAIN (ANALYZE, VERBOSE, BUFFERS)
ANALYZE- realtime execution of queryVERBOSE- adds details like column names at each stepBUFFERS- shows cache hits and misses- only
EXPLAIN- gives planned estimates without execution
Running Explain Analyze
Note before execution
EXPLAIN ANALYSEis not a test run, it actually executes the SQL operations as commanded, hence ensure to use measures so that data is not lost. Avoid execution of write queries on production.EXPLAINon the other hand is safe from operations executing.
To avoid data loss, wrapping all queries in BEGIN and ROLLBACK transactions.
I tried running Explain Analyze a few times but frankly did not receive many answers. The output had a lot of material which required a learning curve. Hence I simply started implementing what the Advisory mentioned to fix.
If the APIs do not speed up even after my below fixes I will ultimately have to learn everything about Explain Analyze and figure the root issues.
For now, lets go ahead.
Wrapping the auth.uid() function in Select
Warning says,
“Table public.widgets has a row level security policy widgets_select_own that re-evaluates current_setting() or auth.uid() for each row. This produces suboptimal query performance at scale.
Resolve the issue by replacing auth.<function>() with (select auth.uid()).”
From a bit of digging, I understood that this is a caching issue. When we said ... WHERE user_id = auth.uid() - the query fetches user id and runs auth.uid() every single time. But auth.uid() is going to remain constant for that user.
So wrapping it in select assigns it to an object which can be cached. Meaning ... WHERE user_id = (select auth.uid() as uid)
✅ Done
Removing unnecessary joints in the RLS queries
When the ownership chains are too big, that leads to multiple table joins which end up adding bottlenecks to the RLS policies. Architecture can be designed to avoid long chains. In my instance the biggest chain was projects -> campaigns -> client_services -> case_studies.
So the policies specific to case studies are going to take more time than others. I could have had case studies assigned directly to users. Users can then map these case studies to any campaigns they want. This avoids creation of case studies or duplication of them.
This would have been a much better architecture and made our APIs faster.
So for next time, I’m gonna have this rule of thumb,
When chains become longer, put more time thinking if that needs to be the way ahead.
❌ Deprioritised
While redoing the architecture was not an option. There was another option where we would create internal database functions that would be non blocking and faster in terms of execution and call them in RLS policies.
The functions were made in a separate non publicly exposed schema within Supabase - however I have kept them aside for future use if speed problems persist.
Note: We can call non publicly exposed functions within the database, but if we have to call functions in client we need to make these functions in an exposed schema like the public.
There are ways to make this functions secure which I will cover in a separate write up.
Un-Complicate the Mess
Beyond the ownership chains, my RLS policies had a lot of other things going on. For instance: The projects of a users are ownership only, so the policy was pretty simple saying user_id = (select auth.uid as uid).
When it went onto campaigns, the requirement was that ACTIVE campaigns be visible to everyone while those with other enums are only for owners. And then there’s an additional requirement that no user should be able to run a select * campaigns and same with other tables - even if it might be just for user published data - I did not want to expose the count and a list of all campaigns and case studies with its data on my platform.
Hence I decided let’s keep RLS policies only for managing ownership while we will offload the rest of the logic into RPC functions.
And there was another issue - that the existing complicated RLS policies were not working as expected either. Since the policies work with the privileges of the one requesting the data - any upstream tables that are restricted fail the policy execution which then returns a false and data is rejected.
So owners were able to view all of their data but non owners would lead into some query execution uncertainty. This was another reason we had to go with RPC functions which are Security Definer functions that run with the privileges of the database owner - meaning queries won’t half execute.
✅ Converted RLS to only focus on Ownership
Implementing the public RPC functions
My SELECT, INSERT, UPDATE, DELETE operations for each table have an ownership clause. And along with this tables campaigns, client services, case studies, and widgets have a second permissive SELECT clause marked as USING (false). For leads the INSERT operation has two separate RLS with one marked as WITH CHECK (false)
The Client Side code instead uses public.rpc() to fetch campaigns and other tables. And same happens with Lead Insert where an rpc function is called.
The RLS policies were failing to execute for lead insert operation - but now with rpc function everything works as expected.
✅ Created secure RPC functions and integrated with Client
Risks of public RPC functions
Your anon key is naturally exposed in the JS chunks in Dev Tools hence anyone who gets their hands on it would be able to execute your public RPC functions. Hence there are following security aspects to note:
- RPC functions are default available for EXECUTE for
publicroles. REVOKE access for public in the same execution you create RPC functions- GRANT access to authenticated only, granting access to anon means execution with anon key is possible.
- Mark functions that give constant outputs as STABLE in their definition
- While defining the functions, explicitly define the
search_path = ''to avoid hack attempts.
Diving into Explain (Analyze, Buffers) for real now
My production APIs are still averaging 2s as server response time. No above fixes have led us to achieve the goldilocks of 300 ms. Hence I have to unfortunately dive deeper into this topic. Let’s first understand the parameters we should look out for:
Below is a table with data from a running explain analyze buffers for projects table. Note: Running select * from <table_name>; leads to the execution RLS policy when we have set the proper local roles - we do not need to add the exact RLS query in our explain analyse query.
- Shared Hit and Shared Read
- Shared Hit = 247. Shared Read = 0
- Minimise Shared Hit + Shared Read sum
- Shared Hit means data is available in Cache. Shared Read mean data is being pulled from I/O which is expensive.
- High Shared Reads means Indexes are required
- Seq Scan or Index Scan? Judge it with Rows Removed
- The planner decides the most optimum way to go ahead
- Whatever method the planner selects we can look out for Rows Removed to judge the efficiency, we want the rows removed to be as low as possible
- Loops
- If we are using functions like auth.uid(). Loops tells us if the function is being run for each row or not.
- STABLE functions meaning those that return same value for a fixed input argument, need not have to be run for each and every row.
- Running it once and caching should be the expectation.
- Planning + Execution Time
- The final North Star metric the Planning + Execution time for our example comes out to 11.3 ms. Which I think is efficient.
| QUERY PLAN |
|---|
| Seq Scan on projects (cost=0.00..2.12 rows=1 width=241) (actual time=3.182..3.188 rows=7 loops=1) |
| Filter: (ANY (user_id = (hashed SubPlan 6).col1)) |
| Rows Removed by Filter: 9 |
| Buffers: shared hit=2 |
| SubPlan 6 |
| → Result (cost=0.07..1.10 rows=1 width=16) (actual time=1.998..2.000 rows=1 loops=1) |
| One-Time Filter: ((InitPlan 5).col1 = (InitPlan 4).col1) |
| Buffers: shared hit=1 |
| InitPlan 4 |
| → Result (cost=0.00..0.03 rows=1 width=16) (actual time=0.004..0.005 rows=1 loops=1) |
| InitPlan 5 |
| → Result (cost=0.00..0.03 rows=1 width=16) (actual time=0.733..0.734 rows=1 loops=1) |
| → Seq Scan on users (cost=0.07..1.10 rows=1 width=16) (actual time=1.256..1.257 rows=1 loops=1) |
| Filter: (user_id = (InitPlan 4).col1) |
| Rows Removed by Filter: 9 |
| Buffers: shared hit=1 |
| Planning: |
| Buffers: shared hit=247 |
| Planning Time: 7.843 ms |
| Execution Time: 3.329 ms |
What is a SubPlan and an InitPlan?
An Init Plan runs once and the output is cached for use. Exactly how we expect STABLE rpc functions in RLS to be executed. The number of rows hence does not matter the time taken to execute Init Plans as they run once.
SubPlan runs multiple times for each and every row. Its better to run a SubPlan on an Index over a Sequence. But if the table is small the planner might decide to go ahead with a Seq Scan + SubPlan.
Look out for index names when the tables become big to ensure they are being used.
Note: The numbering for SubPlan and InitPlan are labels for identification. They are not sequential meaning 1, 2, and 3 are missing because they are hidden - those might have been permission scans or internal database queries.
Summarising Explain Analyze Outputs
| Role | Operation | Table | Total Time | Hits + Reads | Comments |
|---|---|---|---|---|---|
| authenticated | SELECT | projects | 11.3 ms | 247 + 0 | 2 seq with init |
| authenticated | SELECT | campaigns | 16 ms | 311 + 0 | 3 seq with init |
| authenticated | SELECT | client services | 11 ms | 453 + 0 | ~4 seq with init |
| authenticated | SELECT | case studies | 18 ms | 508 + 0 | ++ 1 nested loops |
| authenticated | SELECT | leads | 30 ms | 479 + 0 | ++ 2 nested loops |
| authenticated | INSERT | projects | 1.75 ms | 178 + 0 | - |
| authenticated | INSERT | campaigns | 9 ms | 230 + 0 | - |
| authenticated | INSERT | client services | 9 ms | 398 + 0 | - |
| authenticated | INSERT | case studies | 23 ms | 462 + 0 | - |
| authenticated | INSERT | leads | 17 ms | 403 + 0 | - |
| All our core database operations are likely below 30 ms and still we have a 2 s of Time To First Byte (TTFB). Why? |
Understanding Time To First Byte (TTFB)
TTFB is roughly the server processing time + communication + routing + queuing + content download. This metric further affects the LCP and FCP scores.
The following operations add up to a TTFB time, and these can be tracked for all APIs via the Dev Tools waterfall chart in Timing section.
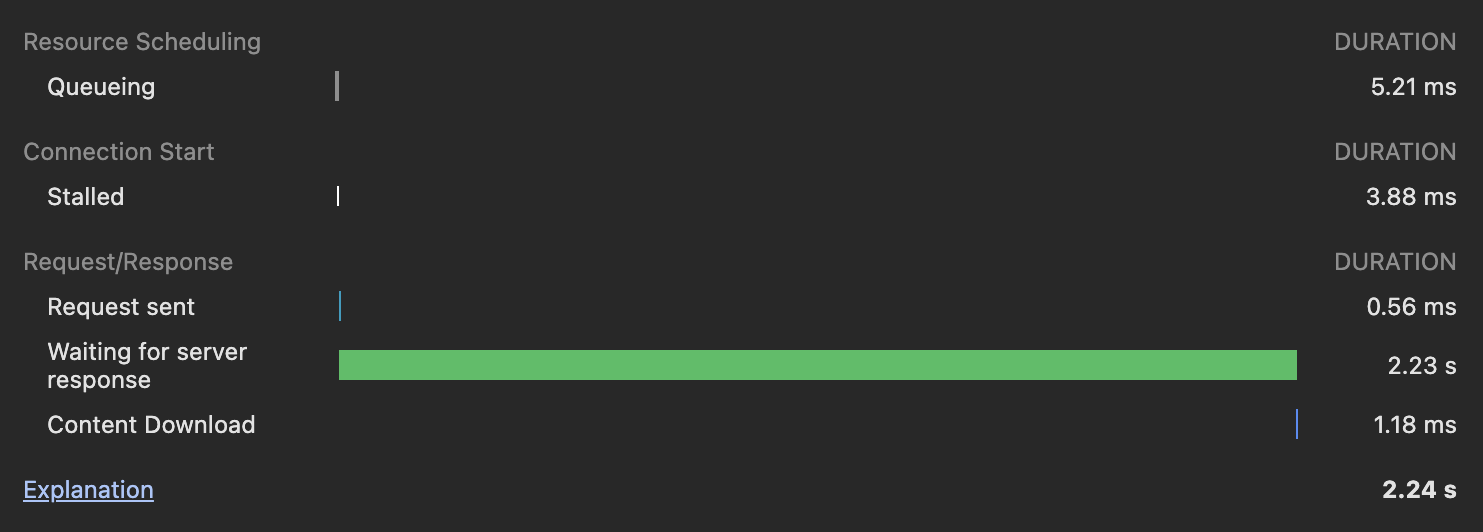
The chart includes,
- Queuing: Tasks are picked by priority
- Stalled: Technical factors can lead to stalling
- DNS Lookup: Browser figuring the IP address under the readable names of our domains
- Initial Connection + Proxy Negotiation: TCP handshake and proxy stuff I do not know a lot about
- Request Sent: Request sent to our server
- Service Worker Preparation + Request: Browser configures a worker
- TTFB (Waiting for server response): Network Latency + Auth/API Overheads + Planning Time + Execution Time
- Content Download: Downloading images and data to finally render the page
We know that our Planning + Execution Time for database operations is under 30 ms. So there are two issues possible:
- The Network Latency is high
- Auth/API Overheads exists
I went to Supabase API Logs and the latency is kinda a very real problem. The APIs are executing with Meta data mentioning the city as Ohio.
- Our frontend is requesting from
us-east-2 - Me the user is connected with the frontend from Pune which is same as Mumbai, that means
ap-south-1 - And our Supabase db is hosted at Mumbai
ap-south-1
That means every request I do to create a project, we go through a continental jump. Pune → Ohio → Mumbai → Ohio → Pune (sending packets under the sea and stuff).
User to Client → almost 250 ms Client to Database → 250 ms Database to Client → 250 ms Client to User → 250 ms
There comes our 1 second for a single request! Now if there are going to be multiple requests we are done.
We cannot have servers everywhere the Users are but we should atleast reduce the Client and Database Communication latency. If database and client are both in Mumbai then I save half the latency for a US user and for an Indian user it will take even less time.
Let’s look for solutions.
Move either Supabase or Netlify
I’ll have to create a new project in Supabase and migrate the entire production database. Not happening. And Netlify has a default version for free users, which is us-east-2 - Ohio!
Even if I pay Netlify they do not have a server in Mumbai. It would be either Singapore or Tokyo then.
So redeploying onto Vercel is the only best option as it allows switching regions.
Here’s are the post Vercel deployment improvements:
| API | TTFB |
|---|---|
| GET projects | 3.8 s |
| POST projects | 625 ms |
| POST campaigns | 700 ms |
| GET campaigns | 300 ms |
| POST services | 650 ms |
| POST case studies | 535 ms |
| POST publish | 510 ms |
| LCP Score | 2 s |
| While our average TTFB earlier was 2 seconds - we are seeing improvements everywhere. GET Projects is likely high because it is trying to fetch all projects as once. I’ll have to add lazy loading for that operation and pagination. |
We can manage slow GET requests in many ways. But when it comes to POST, even if I put a loader or some other graphic, it would have sustained that slow and patchy feeling.
Latency should have been the first thing I should have checked before diving into infrastructure and RLS and RPC functions - but it’s fine because those needed optimisations as well. I reduced a lot of overhead from complex policies and created functions that surely contributed in some 100 ms savings.
Metrics Scored
APIs are now 3x Faster because of 70% Reduction in Latency